It is impossible to separate science from the sociopolitical. As I think about updating my courses this summer, this idea is one that I keep coming back to and wanting to find additional ways to make explicit in my classes.
Last summer, I had the wonderful opportunity to participate in the Energy & Equity summer workshop (link takes you to the portal; find the current workshop info through links on that page). A main part of the workshop is time provided to work on your own project. I was especially lucky to take the workshop at the same time as Allie Boyd, and together we created a mini unit and project.
This Energy… Part 2 unit is meant to come after a typical conservation of energy unit. It leads to a project where students get to examine energy stories (along with entwined associated sociopolitical stories) that are personal to them. I will write about the project in detail in a separate post. This post gives details about the unit.
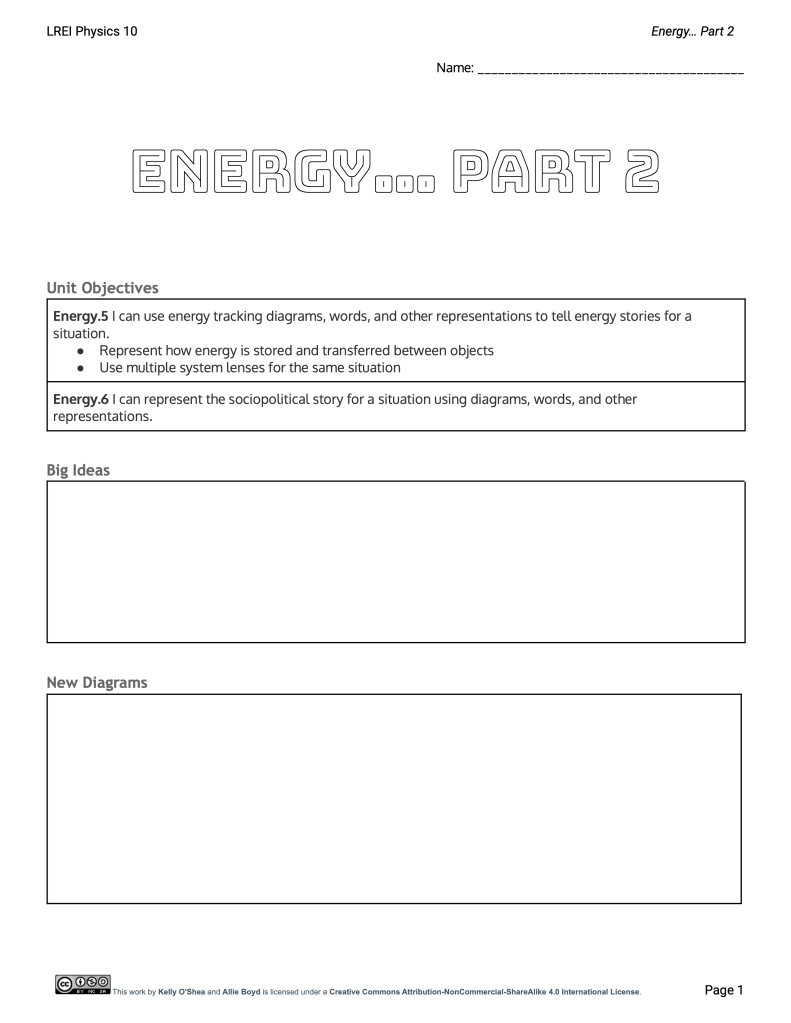
You can see the Google Doc of the packet for this unit at this link or by clicking the image of the front page below.
Energy as a Sociopolitical Concept
The start of the unit opens up space for broadening students’ ideas about energy and physics in general. First, we give some space to raise the question of what else students might expect to learn about energy in a physics class that wasn’t covered in the typical conservation of energy unit that we just finished.
We then have three Agree/Disagree statements that ask students to move around the room to a place that matches up with where they think they are on the agree/disagree spectrum for each of them. (Make one end of the room “agree” and the other end “disagree”.) They can give some reasons as to why they stood where they did. There isn’t a “right” or “wrong” answer, and they don’t come to a consensus. This page of the packet is more of a “warm up” section to get their brains going.
Physics concepts are objective and neutral
These are our Agree/Disagree statements, which are shared one at a time. Students move to a spot in the room depending on their opinions.
Physics culture is objective and neutral
The way physics is used in society is objective and neutral
Then we watch this short video (4 minutes), and students have the chance to jot down notes and talk in small groups about what it raises for them.
Now that we have laid some groundwork for why we might want to expand our study of energy beyond blocks and ramps and introduced the idea of thinking about the sociopolitical nature of these concepts, we’re ready for the rest of the unit.
Energy Tracking Diagrams
In the workshop, we learned about Energy Tracking Diagrams (link to The Physics Teacher article about the diagrams). While energy bar charts (LOLs) are more useful for solving problems and for thinking about distinct snapshots, I love these tracking diagrams for exploring more complex processes. (I’m looking forward to using them in my Biomechanics class this coming year, too!)
Basically, you represent how the energy is being stored, where it is being stored, and the processes by which either of those changes. You show conservation through a one-to-one chain of connections for any “chunk” of energy. Here’s an example for a box sliding across a table:
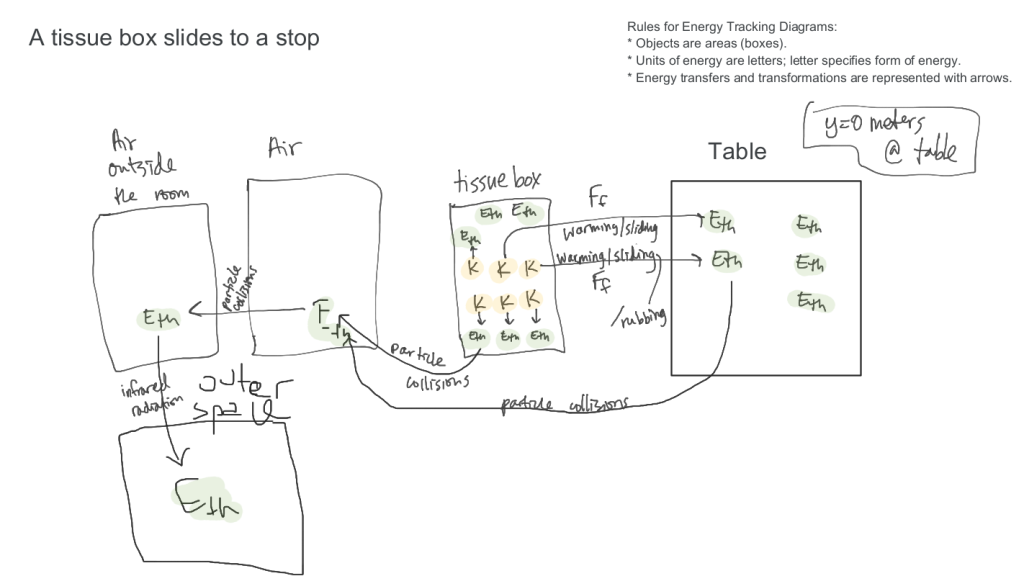
Since this unit is Energy… Part 2, my students were already pretty good at thinking carefully about energy, so they picked up how to draw these diagrams right away with just one example done together. (I did not do a good job of emphasizing the need to label all of the processes on the arrows, but I have a reasonable idea of how I will improve on sharing these with them next time.)
In the unit, they practice these diagrams by working on problems that also challenge them a bit—and which advance our storyline toward thinking about power plants. We use two situations from the Energy Forms & Changes PhET, so the students also get to play with the simulation (which they love) along the way.
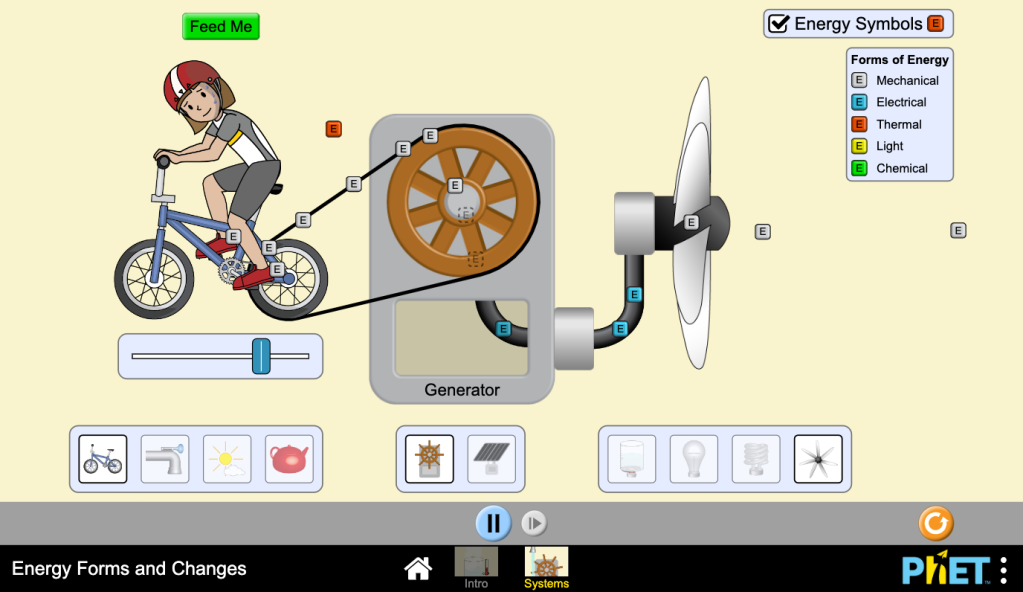
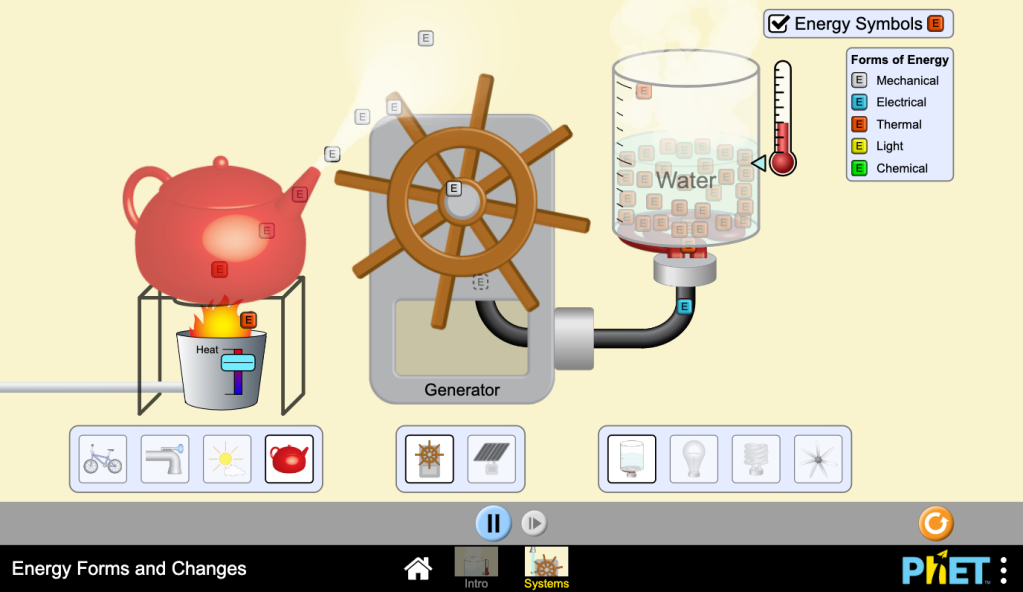
The energy symbols option on the PhET is great because it reduces the cognitive load and the barrier to getting started. I also like that it gives them a start, but that they need to improve on it, too. We can be more specific than “mechanical”, so we should be! And since 9th graders at my school take Chemistry, we can get into thinking about phase energy.
The Energy Story of a Nuclear Power Plant
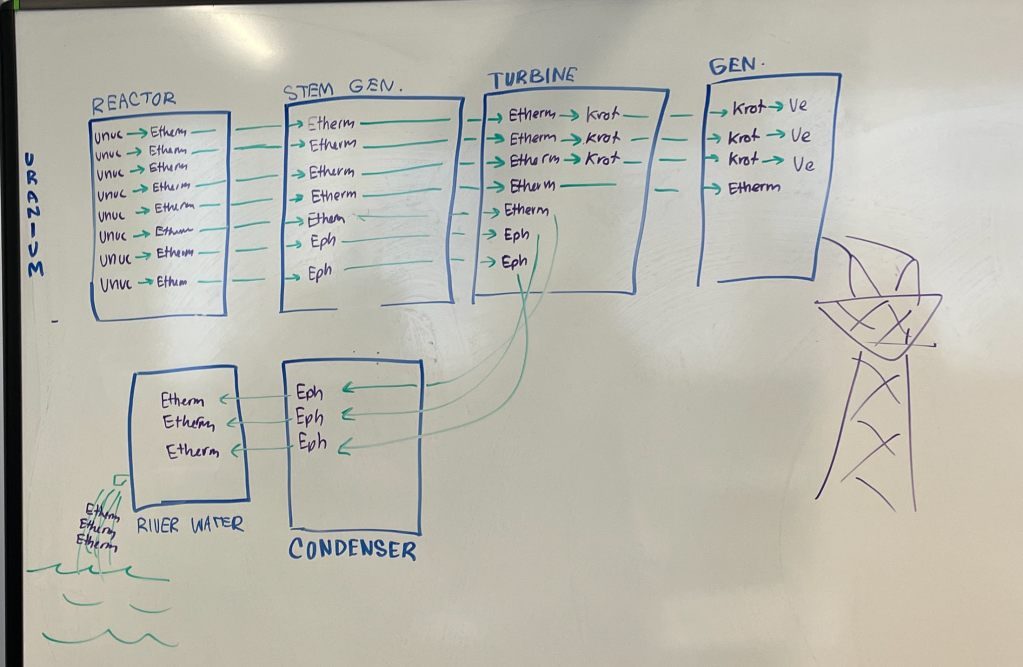
Having done just those two problems, they are ready (to their own astonishment) to represent and explain how energy is stored and transferred in a nuclear power plant.
I had them do a very short card sort (about 5 minutes) for the order of the components in a power plant that I got from the Solar One energy curriculum. The Energy… Part 2 packet includes a little bit of information about the parts of the power plant and this image. I also shared the image with them so they could see the animated version.

Working in groups, then coming together to discuss and create a consensus, they are able to come up with something like this which they drew together on the big whiteboard. Not perfect, but pretty good!
The Sociopolitical Story of a Nuclear Power Plant
To bring this unit back to where we started, we need to examine not only the energy story for a nuclear power plant, but also the sociopolitical story.
For that, we introduced one more new diagram.
Interaction Diagrams / System Schemas
When we first learn about forces, we have a diagram called a system schema that shows all of the relevant objects and how they are interacting with each other. We repurposed this diagram to create a Sociopolitical System Schema. The “objects” are now the characters in that story (people, places, and things relevant to the situation we are examining). Instead of examining one moment in time, we can look backwards and forwards at the situation. Once we have assembled a collection of characters, we can start creating and labeling the connections between them (the interactions)—which might lead us to realize other items that should be added to the schema. To make it easier to rearrange and expand, I had students write the “objects” on sticky notes / index cards first, then make connections on a whiteboard.
Learning the story of a nearby power plant
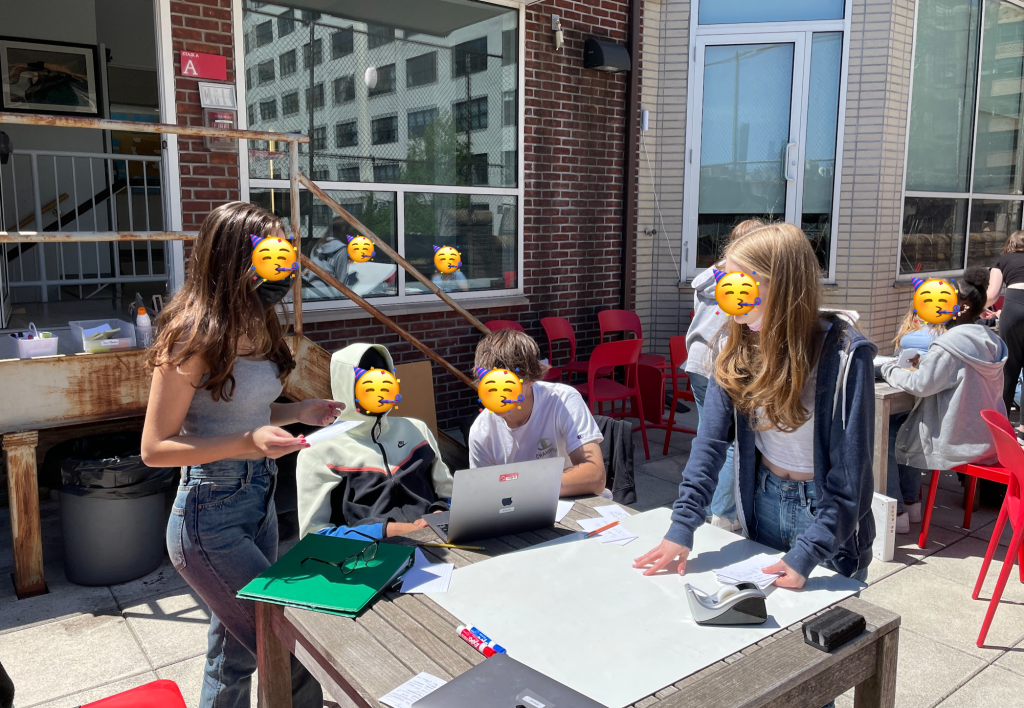
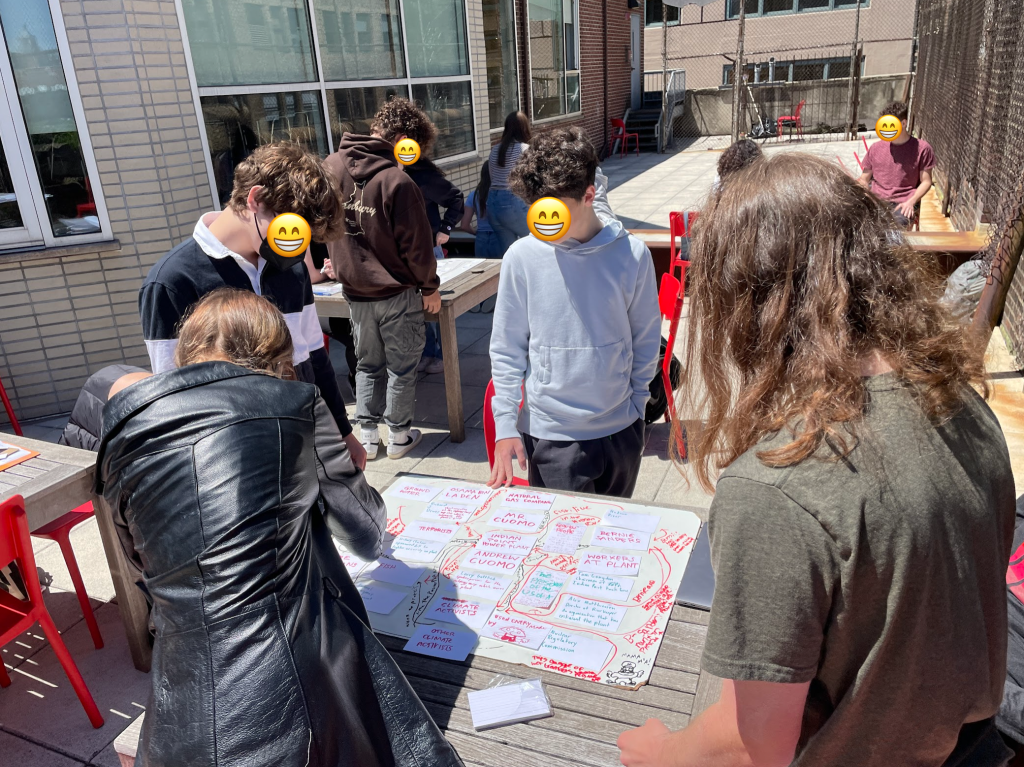
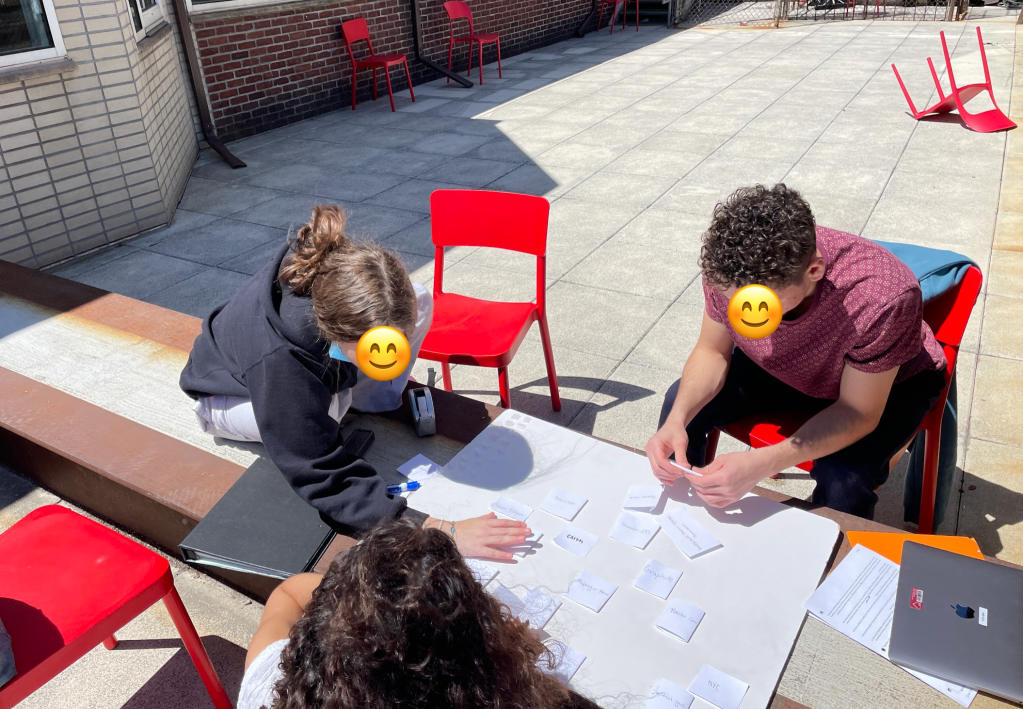
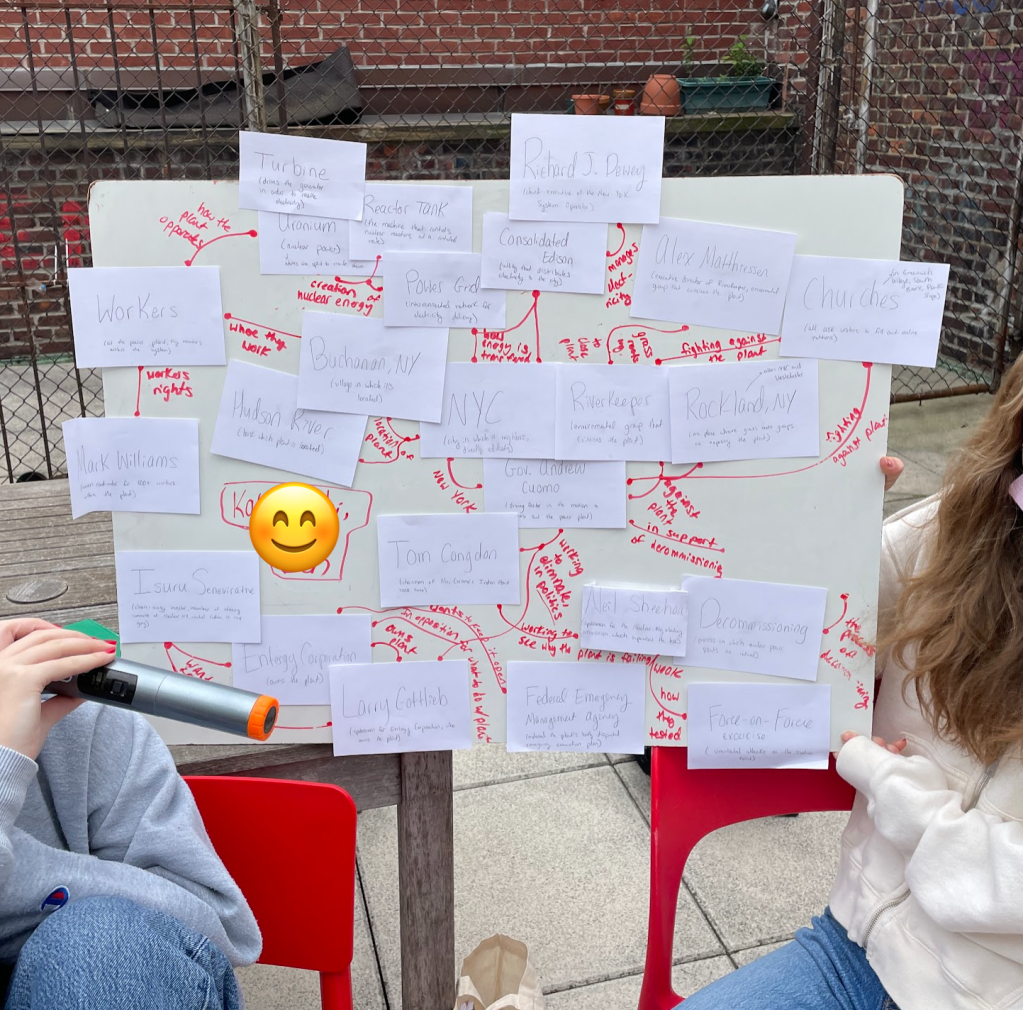
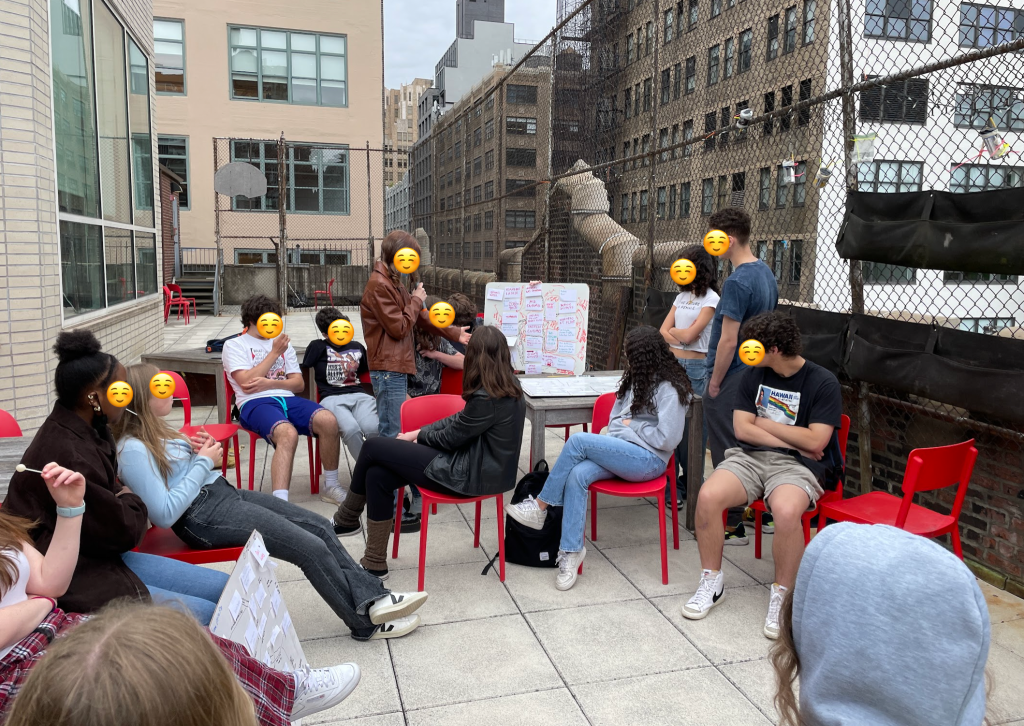
We focused on a specific, local power plant—Indian Point Nuclear Power Plant—which shut down a year ago. Doing this activity together in groups also prepared them to create their own diagrams in the project which followed this unit.
Your Own Energy Story – Mini Project
At the end of this unit, students each do a project where they use energy tracking diagrams and sociopolitical system schemas to tell a personal energy story—either how they get to school or how they cook a favorite meal. Click for another post with the details of that project, the handouts for it, and some student work from this year.


Beautiful work!! 100% with you here on extending the energy conversation to include sociopolitical impact. It makes the unit more closely connected to students’ lives, and serves to more concretely answer the “Why are we learning this stuff?” question.
I’ve never seen the Energy Tracking Diagrams before… wondering if they’re trying to do too much, especially considering that we can always draw an LOL bar chart as a second representation. In our energy storyline unit (centered around the massive power outages in Texas last year) I tried a energy-transfer-focused version of a system schema. We quantified energy with boxes along interactions, ignoring energy forms completely in favor of focusing exclusively on objects and fields. These representations were quite versatile, and a pretty fascinating way to track energy in more complex phenomena.
I also wasn’t sold on them when I first saw them because I already have a strong energy unit, but I think they are a great tool for doing exploratory work rather than problem solving—especially for exploring complex situations where it wouldn’t always be clear exactly when to take each snapshot or when the energy paths are branching.
In finishing up the follow-up post for the project, I came back across this student reflection from the end of the year, which seems relevant, too: “I really liked this unit! Energy Tracking Diagrams (or as I previously, mistakingly called them, Energy Transfer Models,) provided a clear visual of how energy is transferred, especially when portraying the concept that energy doesn’t just “go away” but is transferred to something else. I especially thought that this put the previous units into a perspective that I could understand with more depth.”
[…] post describes a project that follows the Energy… Part 2 unit. If you haven’t read about that (new!) unit yet, this post will probably be confusing. […]
Hi Kelly! I’m thinking again about energy models (always!), and I wonder if you’ve come across the distinction between “models of” vs. “models for”. This paper does a nice job of clarifying the difference – some highlights appear around Page 17-18 if time is limited:
Click to access PB351Xweb.pdf
I’m wondering how you think about this fascinating Energy Story project in light of this difference. How do you prevent the Energy Story from becoming mostly a “model of” the process, rather than prompting students to *use* their energy models in service of sense-making?