DATA INTERPRETATION
Data interpretation is the process of drawing conclusions and inferences from a comprehensive data presented numerically in tabular form by means of an illustration, viz. Graphs, Pie Chart etc.
Thus the act of organizing and interpreting data to get meaningful information is called Data Interpretation.
Example 1 :
Refer to the following information and answer the questions 1 to 5.
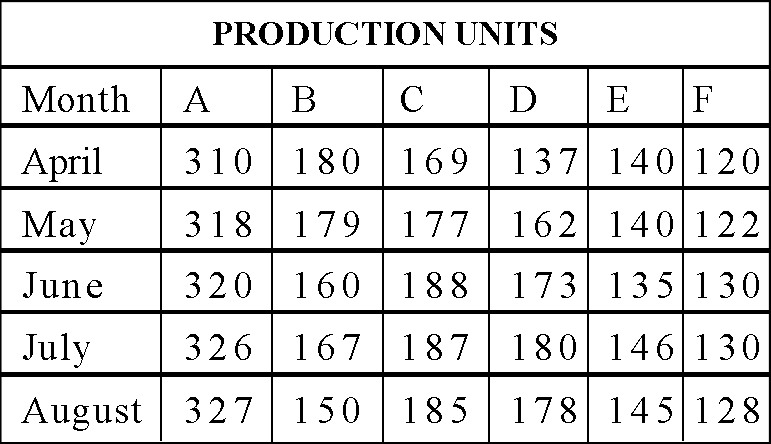
Production of sugar by six major production units in million tonnes.
Question 1 :
In which month the unit B has a contribution of approximately 15% in the total sugar production?
Question 2 :
Which unit shows continuous increase in production of sugar over months?
Question 3 :
In the case of Unit E, in which of the following pairs of months the production of sugar was equal?
Question 4 :
In the month of June, how many units have a share of more than 25% of the total production of sugar?
Question 5 :
What was approximate percentage decrease in sugar production of unit B in June as compared to April?
1. Answer :
1. Total production in April :
= 310 + 180 + 169 + 137 + 140 + 120
= 1056
15% of 1056 = 0.15 x 1056
= 158.4
Total Production in June :
= 320 + 160 + 188 + 173 + 135 + 130
= 1106
15% 1106 = 0.15 x 1106
= 165.9
Total production in July :
= 326 + 167 + 187 + 146 + 130
= 1136
15% of 1136 = 0.15 x 1136
= 170.4
Total Production in August :
= 327 + 150 + 185 + 178 + 145 + 128
= 1113
15% of 1113 = 0.15 x 1113
= 166.95
≈ 167
That is, in Month July, the Unit B has a contribution of approximately 15% in the total sugar production.
2. Answer :
Unit A shows continuous increase in production of sugar over months.
3. Answer :
In Unit E, the pair of months that shows equal sugar production is April and May.
4. Answer :
Total Production in June :
= 320 + 160 + 188 + 173 + 135 + 130
= 1106
25% of 1106 = 0.25 x 1106
= 276.5 units
Unit A shows more than 25% of the total production of sugar in the month June.
5. Answer :
In unit B, the production in June is 160 and the production in April is 180 units.
Decrease in percentage :
= 11.11 %
≈ 11%
Example 2 :
Refer to the following graph and answer the questions 6 to 10.
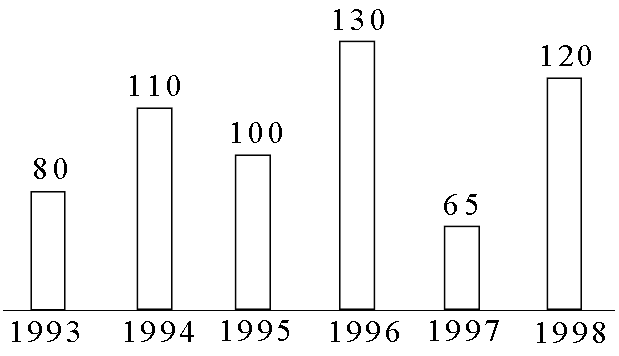
Production of food grain over the years (1000 tonnes)
Question 6 :
In the case of how many years was the production below the average production of the given years?
Question 7 :
What was the percentage drop in production from 1996 to 1997?
Question 8 :
In which year was the production 50% of the total production in 1993 and 1998 together ?
Question 9 :
If the production in 1999 will be above the average production of the given years, what could be the minimum production for 1999?
Question 10 :
What was the approximate percentage increase in production from 1993 to 1994 ?
6. Answer :
Average production :
= 100.833 thousand tonnes
≈ 100900 tonnes
Production in 1993, 1995 and 1997 was below the average.
7. Answer :
Production in 1996 = 130 thousand tonnes
Production in 1997 = 65 thousand tonnes
Decrease in percentage :
= 50%
8. Answer :
Total Production in 1993 and 1998 :
= 80 + 120
= 200
50% of 200 = 0.5 x 200 = 100
The production in 1995 was 50% of the total production in 1993 and 1998.
9. Answer :
Average production = 100900 tonnes
Therefore the minimum production in 1999 will be 100900 tonnes.
10. Answer :
Production in 1993 = 80 thousand tonnes
Production in 1994 = 110 thousand tonnes
Increase in percentage :
≈ 38%
Kindly mail your feedback to v4formath@gmail.com
We always appreciate your feedback.
©All rights reserved. onlinemath4all.com
Recent Articles
-
Simplifying Algebraic Expressions with Fractional Coefficients
May 17, 24 08:12 AM
Simplifying Algebraic Expressions with Fractional Coefficients -
The Mean Value Theorem Worksheet
May 14, 24 08:53 AM
 The Mean Value Theorem Worksheet
 -
Mean Value Theorem
May 14, 24 02:48 AM
 Mean Value Theorem