UNIT RATE SLOPE WORKSHEET
Problem 1 :
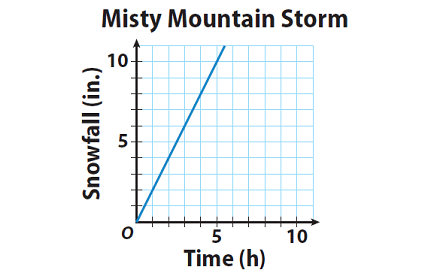
A storm is raging on Misty Mountain. The graph shows the constant rate of change of the snow level on the mountain.
Questions :
1. Find the slope of the graph using the points (1, 2) and (5, 10). Remember that the slope is the constant rate of change.
2. Find the unit rate of snowfall in inches per hour. Explain your method.
3. Compare the slope of the graph and the unit rate of change in the snow level. What do you notice ?
4. Which unique point on this graph can represent the slope of the graph and the unit rate of change in the snow level ? Explain how you found the point.3
Problem 2 :
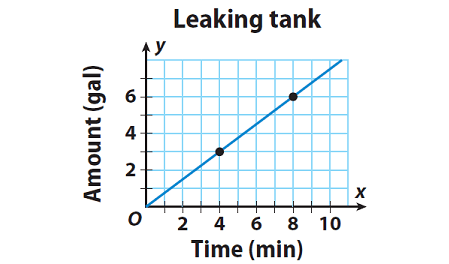
Water is getting leaked from a tank. The graph shows the rate at which water is leaking from a tank.
Questions :
1. Find the slope of the graph using the points (4, 3) and (8, 6). Remember that the slope is the constant rate of change
2. Find the unit rate of water in gallons per minute. Explain your method.
3. Compare the slope of the graph and the unit rate of change in amount of water. What do you notice ?
4. Which unique point on this graph can represent the slope of the graph and the unit rate of change in the amount of water ? Explain how you found the point.

Answers
1. Answer :
1. Find the slope of the graph using the points (1, 2) and (5, 10). Remember that the slope is the constant rate of change.
Change in y-value / Change in x-value :
= (10-2)/(5-1)
= 8 / 4
= 2
2. Find the unit rate of snowfall in inches per hour. Explain your method.
2 inches per hour; Sample answer : The point (1, 2) is on the line, and represents 2 inches snowfall in 1 hour.
3. Compare the slope of the graph and the unit rate of change in the snow level. What do you notice ?
They are the same.
4. Which unique point on this graph can represent the slope of the graph and the unit rate of change in the snow level ? Explain how you found the point.
(1, 2) ; Sample answer : the unit rate is the amount of snow in 1 hour. So I found the point with an x-coordinate of 1. That point is (1, 2), which, along with another point on the graph, gives 2 as the slope.
2. Answer :
1. Find the slope of the graph using the points (4, 3) and (8, 6). Remember that the slope is the constant rate of change.
Change in y-value / Change in x-value :
= (6-3)/(8-4)
= 3 / 4
= 0.75
2. Find the unit rate of water in gallons per minute. Explain your method.
0.75 gallons per min ; Sample answer : The point (1, 0.75) is on the line, and represents 0.75 gallons in 1 min.
3. Compare the slope of the graph and the unit rate of change in amount of water. What do you notice ?
They are the same.
4. Which unique point on this graph can represent the slope of the graph and the unit rate of change in the amount of water ? Explain how you found the point.
(1, 0.75) ; Sample answer : the unit rate is the amount of water is getting leaked in 1 minute. So I found the point with an x-coordinate of 1. That point is (1, 0.75). And also, the y-coordinate of this point represents the slope 0.75.
Kindly mail your feedback to v4formath@gmail.com
We always appreciate your feedback.
©All rights reserved. onlinemath4all.com
Recent Articles
-
Trigonometry Pythagorean Identities
May 02, 24 11:43 PM
Trigonometry Pythagorean Identities -
Trigonometry Quotient Identities
May 02, 24 11:08 PM
Trigonometry Quotient Identities -
Unit Rates
May 02, 24 09:27 AM
Unit Rates - Concept - Examples with step by step explanation