
How to Teach Venn Diagrams to Elementary School Students
Ask a Tech Teacher
JULY 26, 2022
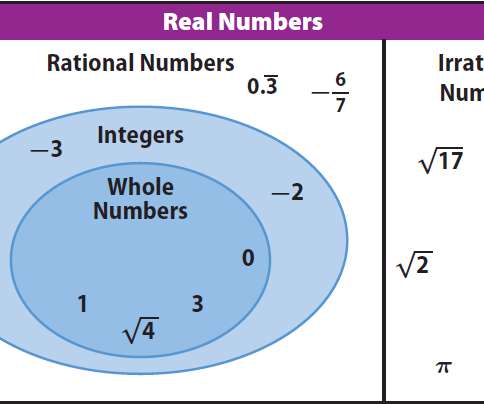
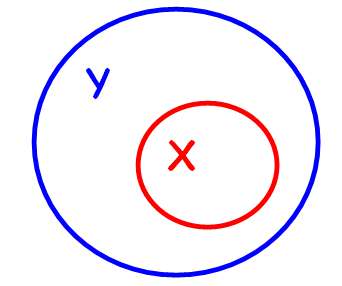
Venn Diagrams are one of the most visual approaches to showing students the logical relationships between sets and connectivity of data. It uses overlapping circles to show the wholeness of data and then where they overlap other data sets. It’s easy to find templates for them–in MS Office, Google Apps, Canva, and more. One of our Ask a Tech Teacher crew has organized the basics on how to teach Venn Diagrams to elementary-age students: What is a Venn Diagram.


Let's personalize your content