REPRESENTING LINEAR NON PROPORTIONAL RELATIONSHIPS
A linear equation is an equation whose solutions are ordered pairs that form a line when graphed on a coordinate plane. Linear equations can be written in the form y = mx + b. When b ≠ 0, the relationship between x and y is non proportional.
Example 1 :
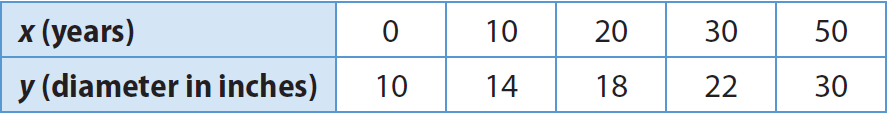
The diameter of a Douglas fir tree is currently 10 inches when it is measured at chest height. After 50 years, the diameter is expected to increase by an average growth rate of 2/5 inch per year. The equation y=(2/5)x+10 gives y, the diameter of the tree in inches, after x years. Draw a graph of the equation. Describe the relationship.
Solution :
Step 1 :
Make a table. Choose several values for x that make sense in context. To make calculations easier, choose multiples of 10.
Step 2 :
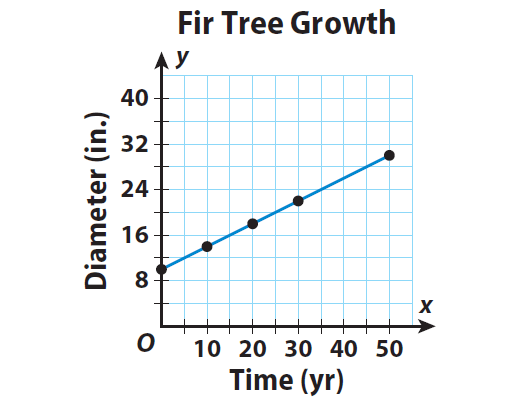
Plot ordered pairs from the information in the table. Then draw a line connecting the points to represent all the possible solutions.
Step 3 :
The relationship is linear but non proportional. The graph is a line but it does not go through the origin.
Example 2 :
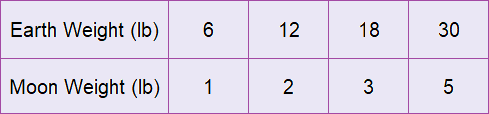
The equation y = x/6 gives y, the weight of moon in pounds for the weight of earth, x in pounds. Draw a graph of the equation. Describe the relationship.
Solution :
Step 1 :
Make a table. Choose several values for x that make sense in context. To make calculations easier, choose multiples of 6.
Step 2 :
Plot ordered pairs from the information in the table. Then draw a line connecting the points to represent all the possible solutions.
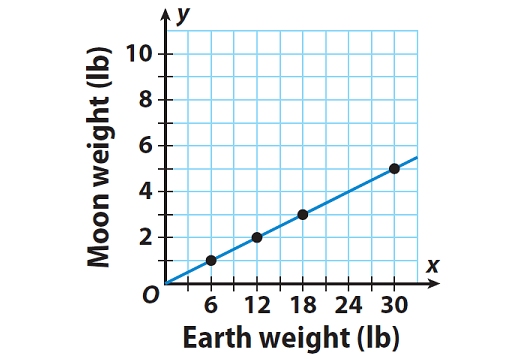
Step 3 :
The relationship is linear and also proportional. Because the graph is a line and also it goes through the origin.
Example 3 :
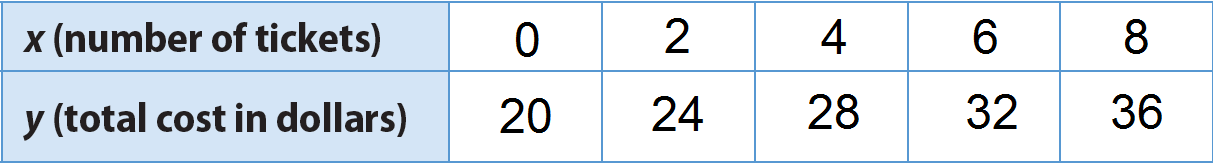
The entrance fee for Mountain World theme park is $20. Visitors purchase additional $2 tickets for rides, games, and food. The equation y = 2x + 20 gives the total cost, y, to visit the park, including purchasing x tickets. Explain why the relationship between number of tickets and total cost is not proportional.
Solution :
Step 1 :
Choose several values for x that make sense in context.
Step 2 :
Plot the ordered pairs from the table. Describe the shape of the graph.
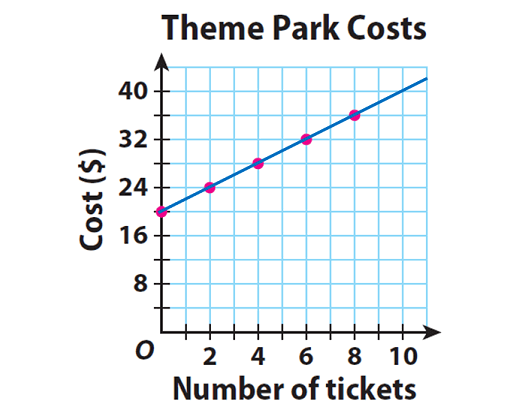
Step 3 :
In the above graph, the points lie on a line. But the line does not pass through the origin. So, the relationship between number of tickets and total cost is not proportional.
Reflect
The relationship between two quantities is linear. How can you conclude from the graph whether the relationship is proportional or non proportional?
If the relationship between the two quantities is linear, its graph will be a line.
If the line goes through the origin, then the relationship is proportional.
If the line does not go through the origin, then the relationship is non proportional.
Kindly mail your feedback to v4formath@gmail.com
We always appreciate your feedback.
©All rights reserved. onlinemath4all.com
Recent Articles
-
Trigonometry Even and Odd Iidentities
May 04, 24 12:15 AM
 Trigonometry Even and Odd Iidentities
 -
SOHCAHTOA Worksheet
May 03, 24 08:50 PM
 SOHCAHTOA Worksheet
 -
Trigonometry Pythagorean Identities
May 02, 24 11:43 PM
Trigonometry Pythagorean Identities