USING SLOPE INTERCEPT FORM TO GRAPH A LINE
Recall that y = mx + b is the slope-intercept form equation of a line.
In this form, it is easy to see the slope m and the y-intercept b.
So we can use this form to quickly graph a line by plotting the point (0, b) and using the slope to find a second point.
Example 1 :
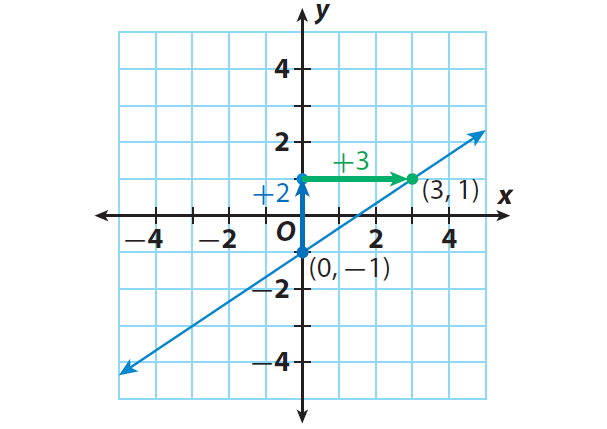
Graph the line whose equation is y = (2/3)x - 1.
Solution :
Step 1 :
The y-intercept is b = -1. Plot the point that contains the y-intercept : (0, -1).
Step 2 :
The slope is m = 2/3. Use the slope to find second a point. Since the slope = rise / run, from (0, -1), count up 2 units and right 3 units.
Then, the new point is (3, 1).
Step 3 :
Draw a line through the points.
Example 2 :
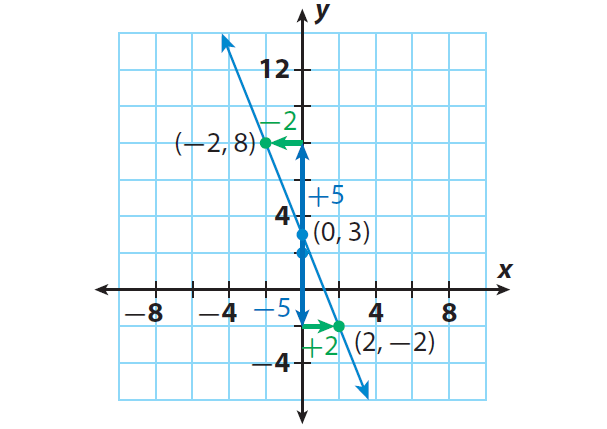
Graph the line whose equation is y = (-5/2)x + 3.
Solution :
Step 1 :
The y-intercept is b = 3. Plot the point that contains the y-intercept : (0, 3).
Step 2 :
The slope is m = -5/2. Use the slope to find second a point. Since the slope = rise / run, from (0, 3), count down 5 units and right 2 units or up 5 units and left 2 units.
Then, the new point is (2, -1) or (-2, 8).
Step 3 :
Draw a line through the points.
Example 3 :
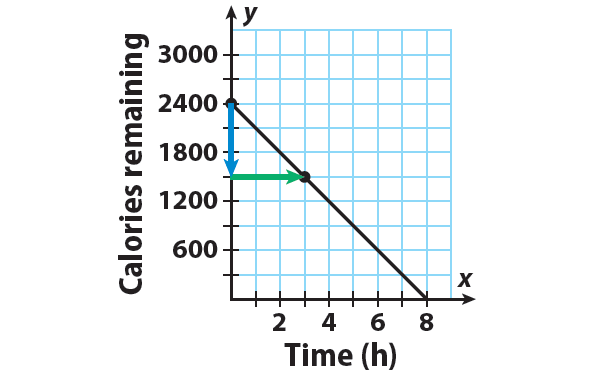
Ken has a weekly goal of burning 2400 calories by taking brisk walks. The equation y = -300x + 2400 represents the number of calories y Ken has left to burn after x hours of walking which burns 300 calories per hour. After how many hours of walking will Ken have 600 calories left to burn ? After how many hours will he reach his weekly goal?
Solution :
Step 1 :
y = -300x + 2400
The y-intercept is b = 2400. Plot the point that contains the y-intercept : (0, 2400).
Step 2 :
Write the slope as a fraction.
m = -300/1
= -600/2
= -900/3
Using the slope as -900/3 helps in drawing a more accurate graph.
The slope is m = -900/3. Use the slope to find second a point. Since the slope = rise / run, from (0, 2400), count down 900 units and right 3 units.
Then, the new point is (3, 1500).
Step 3 :
Draw a line through the points.
Step 4 :
To find after how many hours of walking will Ken have 600 calories left to burn,
Locate 600 calories on the y-axis. Read across and down to the x-axis.
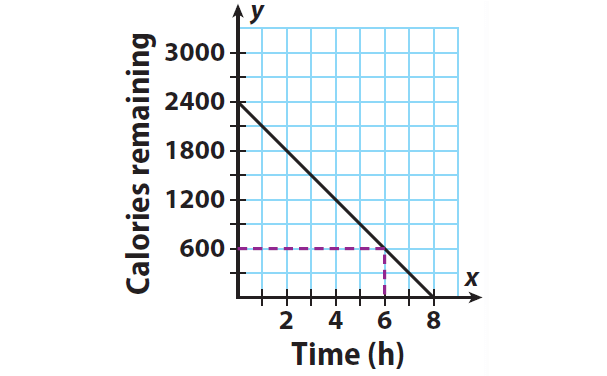
From the graph, we can know that Ken will have 600 calories left to burn after 6 hours.
Step 5 :
Ken will reach his weekly goal when the number of calories left to burn is 0. Because every point on the x-axis has a y-value of 0, find the point where the line crosses the x-axis.
Ken will reach his goal after 8 hours of brisk walking.
Kindly mail your feedback to v4formath@gmail.com
We always appreciate your feedback.
©All rights reserved. onlinemath4all.com
Recent Articles
-
Trigonometry Even and Odd Iidentities
May 05, 24 12:25 AM
 Trigonometry Even and Odd Iidentities
 -
SOHCAHTOA Worksheet
May 03, 24 08:50 PM
 SOHCAHTOA Worksheet
 -
Trigonometry Pythagorean Identities
May 02, 24 11:43 PM
Trigonometry Pythagorean Identities