IDENTIFY PROPORTIONAL RELATIONSHIPS BY GRAPHING
The graph of a proportional relationship between x and y is a straight line passing through the origin (0, 0). Two variables have a proportional relationship if the ratio of one variable to the other is constant. A proportional relationship between x and y can be modeled by the equation y = kx.
Example 1 :
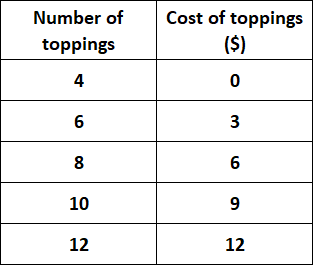
A local frozen yogurt shop is known for their monster sundaes. Create a table then graph and explain if the quantities are proportional to each other or not.
Solution :
Now we need to draw the graph of the given data.
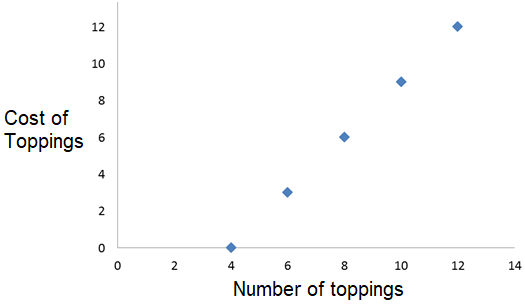
Although the graph lies in a straight line, the quantities are not proportional to each other because the line does not go through the origin.
Each topping does not have the same unit cost.
So, the above situation does not have the proportional relationship.
Example 2 :
The school library
receives money for every book
sold at the school’s book fair.
Create a table then graph and
explain if the quantities are
proportional to each other or
not.
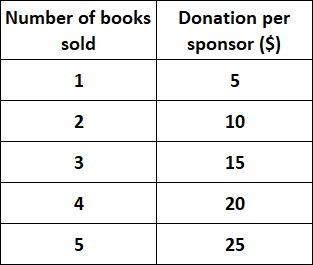
Solution :
Now we need to draw the graph of the given data.
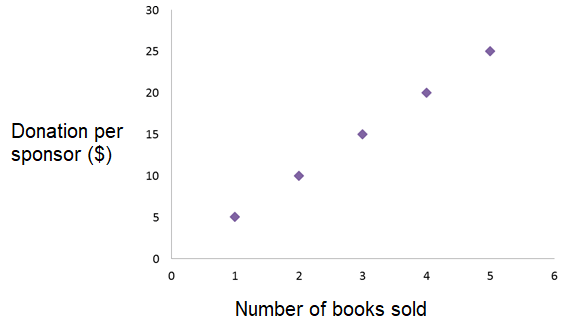
The quantities are proportional to each other because the points lie in a straight line and go through the origin.
Each book sold brings in $5.00 no matter how many books are sold.
A proportional relationship between x and y can be modeled by the equation y = kx.
To find the value of k, we need to divide y by x.
5/1 = 5
10/2 = 5
Here k = 5. So, we can represent the above situation by the linear equation y = 5x.
So, the above situation have the proportional relationship.
Example 3 :
Your uncle just bought a hybrid car and wants to take you and your siblings camping. Create a table then graph and explain if the quantities are proportional to each other or no.
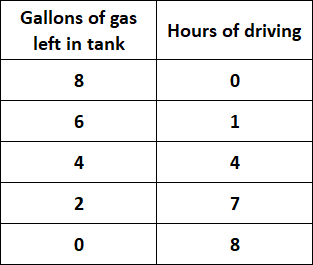
Solution :
Now we need to draw the graph of the given data.
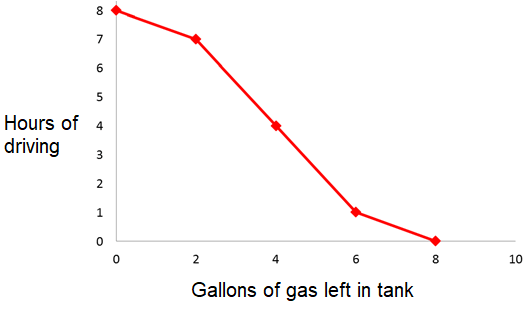
The graph is not a straight line passing through the origin so the quantities are not proportional to each other. The number of gallons of gas vary depending on how fast or slow the car is driven.
So, the above situation does not have the proportional relationship.
Example 4 :
For a Science project
Eli decided study colonies of
mold. He observed a piece of
bread that was molding. Create
a table then graph and explain if
the quantities are proportional
to each other or not.
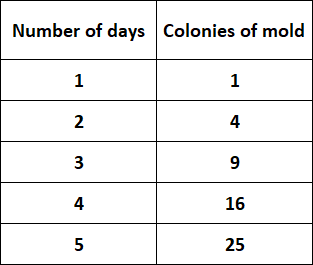
Solution :
Now we need to draw the graph of the given data.
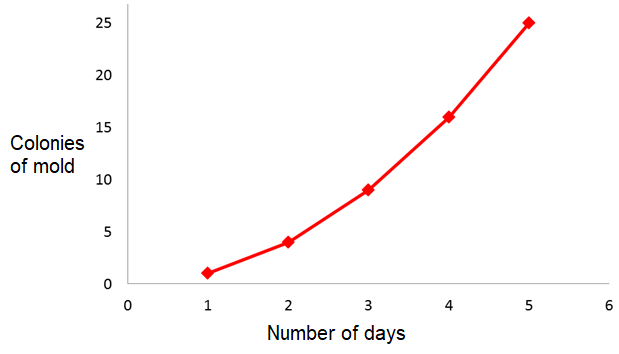
Although the graph looks as though it goes through the origin, the quantities are not proportional to each other because the points do not lie on a straight line. Each day does not produce the same amount of colonies as the other days.
That is 1/1 = 1 but 4/2 is not equal to 1.
So, the above situation does not have the proportional relationship.
Kindly mail your feedback to v4formath@gmail.com
We always appreciate your feedback.
©All rights reserved. onlinemath4all.com
Recent Articles
-
Trigonometry Even and Odd Iidentities
May 04, 24 12:15 AM
 Trigonometry Even and Odd Iidentities
 -
SOHCAHTOA Worksheet
May 03, 24 08:50 PM
 SOHCAHTOA Worksheet
 -
Trigonometry Pythagorean Identities
May 02, 24 11:43 PM
Trigonometry Pythagorean Identities