How Can Analytics Augment Open-Ended Learning?
- 18 April, 2022
- Reading Time: 6 mins


Learning is better retained when the learner connects with the content on a personal level. This is where experiential learning steps in. Instructional simulations are a typical example of experiential learning.
Unlike other educational tools, simulations are highly interactive and open-ended. There is no linear progression of problems and no right or wrong answer or attempt. Individual learners can manipulate and explore the simulation in many ways. In addition, simulations do not include conventional measures of achievement.
The problem arises when teachers and educators lack important insights on how learners interact with simulations. The nature of the data produced by these interactions is quite unique. It needs to be displayed via an effective dashboard design that shows data sources, analysis, and visualizations for these open-ended and exploratory environments.
What can we achieve through learning data?

Simulations can produce multiple types of data that can help institutions and educators do the following:
1. Assess the attainment of educational goals and objectives:
Gathering and retaining data on learner performance is necessary for teachers to monitor and intervene early when learners require remediation to improve performance.
2. Enable strategic planning:
Usage data, in particular, helps in strategic planning. It can help school leaders understand the degree of engagement with a particular course, which can lead to important financial or product and buying decisions. It gives educators a way to gauge the overall learning improvement by browsing through the academic records generated by the simulation.
3. Implementation of simulations:
Data on how learners interact with simulations can help teachers build lesson plans that are more tailored to each student’s needs. Since the feedback from simulations is almost instantaneous, this allows time for the creation of supplementary support items to enhance learning. Thus, a teacher receives a better picture of how to effectively implement simulations in their teaching.
4. Assessing effective kinds of simulations:
Since simulations are not a one-size-fits-all, not all content can be taught effectively using a single type of simulation. Usage data can help determine what kind of simulations suit different content types and engage learners in deep learning.
How to design simulations in step with learning levels
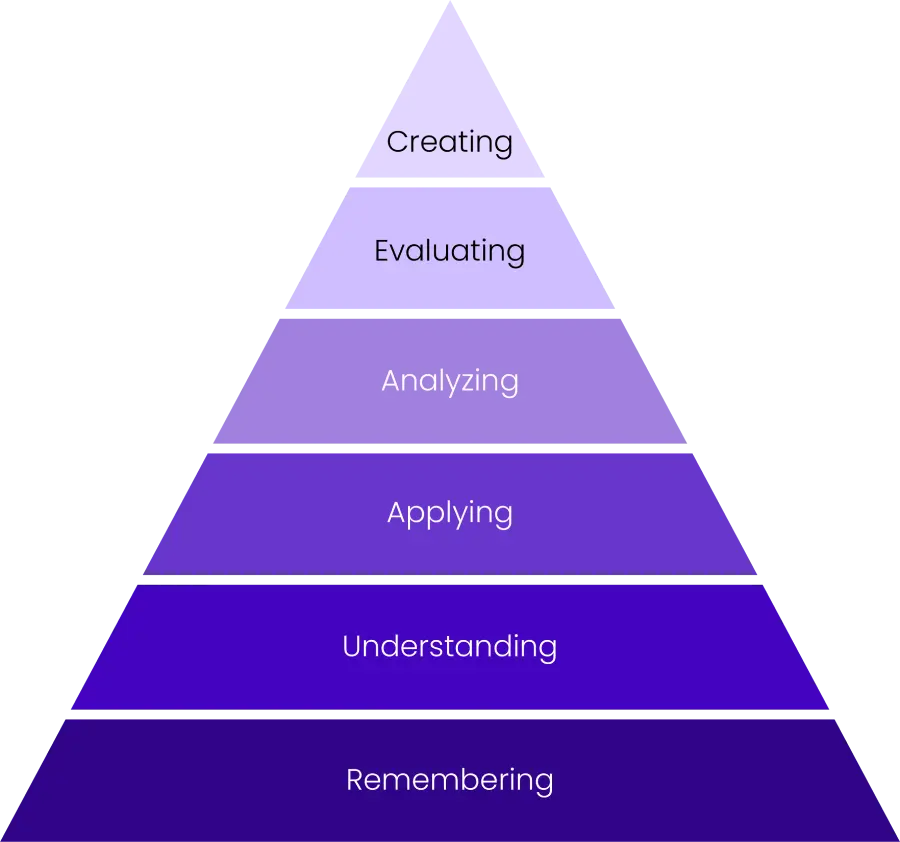
Bloom’s taxonomy provides a reasonable way of organizing the learning experience so learners can build skills in progression. Typically, a simulation is designed to enable learners to attain mastery of a concept, and the objectives of a simulation are mainly pertaining to the “Apply” and above levels of Bloom’s taxonomy.
There are two aspects of a simulation: knowledge and skill. Learners apply the knowledge in certain scenarios or perform an activity testing procedural skills. Simulations promote the use of critical and evaluative thinking. Some simulations are evaluative (learner is supposed to make some selection and interact to complete a task) while some are merely observatory (learner makes some selection and observes).
Which analytics are crucial to the learning process?

Essential data can be captured around the completion, user interactions on each step, repeat play, or first-time play. If the simulation is score-based then the score, the number of attempts, and mistakes committed are captured.
A dashboard should effectively communicate learners’ interaction patterns with the sims. This will help provide new insight and feedback to teachers and researchers as they implement sims in instruction.
1. The percentage of scenarios covered for each of the sub-goals by the learner during simulation play
a. Sub-goals will be defined in the storyboard
b. These will be mapped to Bloom’s taxonomy level
c. Range of values/range of number of attempts for each sub-goal
d. % attempted by the learner
e. A sequence of scenarios covered by the learner
f. Scenarios not covered
2. Duration of time spent by the learner on each of the sub-goal activities OR sub-activities within the sub-goals
a. Comparison vs. ideal time planned for a learner in the storyboard
b. Performance of time spent across multiple attempts
c. % of learners completed before the planned time, on time, or after the planned time.
3. Evaluative activities
a. Number of attempts by the learner in a question to reach the final correct answer
b. Record a sequence of selected options for a particular question. It will help the teacher to understand where the learners are getting confused if the options are close distractors.
c. Accuracy of attempts across multiple attempts
Dashboard for learning performance monitoring

Dashboards enable ongoing performance monitoring and bespoke learning plans that aid in the movement toward developmental milestones. The dashboards provide feedback on performance, accurate visualizations, and analysis of performance data.
The overall objective of a LA Dashboard is to improve learning.
The subgoals of the dashboards include providing feedback on learning activities, supporting decision-making and motivation, reducing dropouts, and increasing engagement.
1. Learner Activity Meter: This is a line graph/scatter plot that shows the time spent by learners on each element/ subgoal of the activity. It is compared with the ideal time vs the average time spent by the batch or group of learners.
2. % Completion Graphs
3. Scenario coverage
4. Track different learners’ configurations with the sim: Tracking whether the learners have completed certain steps of the sim
5. Duration in specific level/questions/ area
6. Time spends vs completion percentage graph: By capturing the time spend we can capture the completion of the simulation by comparing it with the ideal time.
7. List and percentage of simulation elements used
8. Level of completion/success: The progress of an activity reached by learners is tracked.
How to build effective analytics dashboards for learning

For an effective dashboard, the following parameters have to be kept in mind:
1. What specific information would the teacher like to know about the learners’ interaction with the sim?
2. How would the teacher make use of that information?
3. What kinds of questions have to be considered when an activity is designed? Assign an activity that requires the use of sims.
4. What level of metadata tagging is needed in the simulation?
Thus, a teacher dashboard to analyze and visualize learner interaction is crucial for responding to teacher needs and providing opportunities for improved classroom implementation of such simulations.

Prateeksha Dutt
As a Lead Instructional Designer with Magic Edtech, Prateeksha is actively engaged in conceptualizing and designing various digital learning objects and immersive offerings.
Explore the latest insights