CONSTRUCTION OF FREQUENCY POLYGON
Frequency Polygon is another method of representing frequency distribution graphically.
Draw a histogram for the given continuous data.
Mark the middle points of the tops of adjacent rectangles. If we join these middle points successively by line segment, we get a polygon. This polygon is called the frequency polygon.
It is customary to bring the ends of the polygon down to base level by assuming a lower class of a frequency and highest class of a frequency.
Frequency Polygon can be constructed in two ways:
(i) Using histogram
(ii) Without using histogram.
Constructing Frequency Polygon Using Histogram
Step 1 :
Obtain the frequency distribution from the given data and draw a histogram.
Step 2 :
Join the mid points of the tops of adjacent rectangles of the histogram by means of line segments.
Step 3 :
Obtain the mid points of two assumed class intervals of zero frequency, one adjacent to the first bar on its left and another adjacent to the last bar on its right.
These class intervals are known as imagined class interval.
Step 4 :
Complete the polygon by joining the mid points of first and the last class intervals to the mid point of the imagined class intervals adjacent to them.
Example 1 :
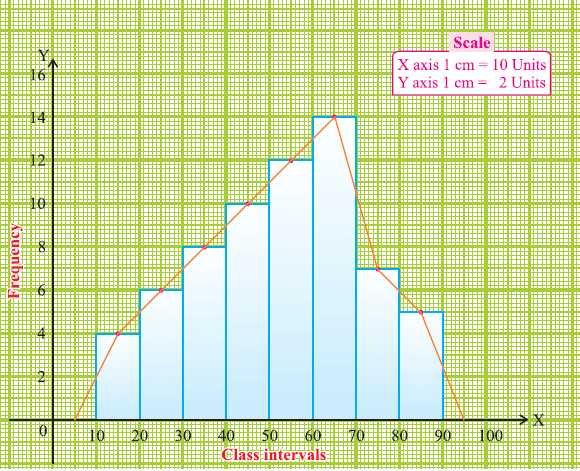
Draw a frequency polygon imposed on the histogram for the following distribution.
|
Class Interval 0 - 10 10 - 20 20 - 30 30 - 40 40 - 50 50 - 60 70 - 80 80 - 90 |
Frequency 4 6 8 10 12 14 7 5 |
Solution :
Take the class-intervals along the X-axis and frequencies along the Y-axis with appropriate scale as shown in the figure given below.
Draw a histogram for the given data.
Now mark the mid points of the upper sides of the consecutive rectangles.
We also mark the midpoints of the assumed class intervals 0-10 and 90-100.
The mid points are joined with the help of a ruler.
The ends of the polygon are joined with the mid points of 0-10 and 90-100. Now, we get the frequency polygon.
Example 2 :
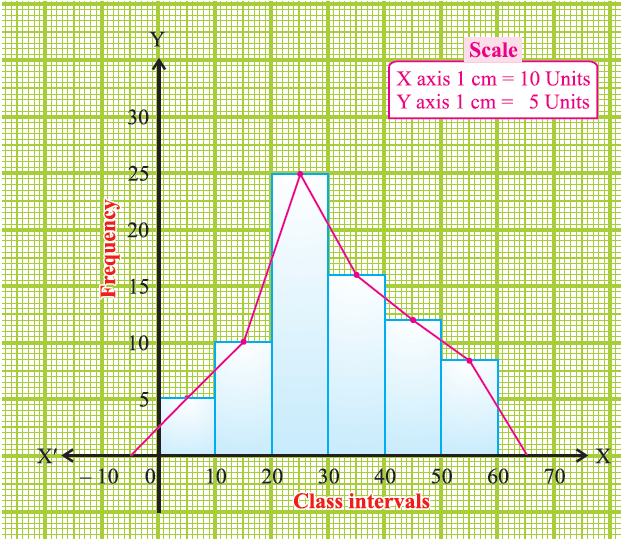
Draw a frequency polygon of the following data using histogram.
|
Class Interval 0 - 10 10 - 20 20 - 30 30 - 40 40 - 50 50 - 60 |
Frequency 5 10 25 16 12 8 |
Solution :
Mark the class intervals along the X-axis and the frequencies along the Y-axis with appropriate scale shown in the figure given below.
Draw a histogram for the given data. Now, mark the mid points of the upper sides of the consecutive rectangles.
Also we take the imagined class interval (-10) - 0 and 60 - 70.
The mid points are joined with the help of a ruler. The ends of the polygon are joined with the mid points of the imagined class intervals (-10)-0 and 60 - 70.
Now we get the frequency polygon.
Note :
Sometimes imagined class intervals do not exist.
For example, in case of marks obtained by the students in a test, we cannot go below zero and beyond maximum marks on the two sides.
In such cases, the extreme line segments are only partly drawn and are brought down vertically so that they meet at the mid points of the vertical left and right sides of first and last rectangles respectively.
Using this note, we will draw a frequency polygon for the following example:
Example 3 :
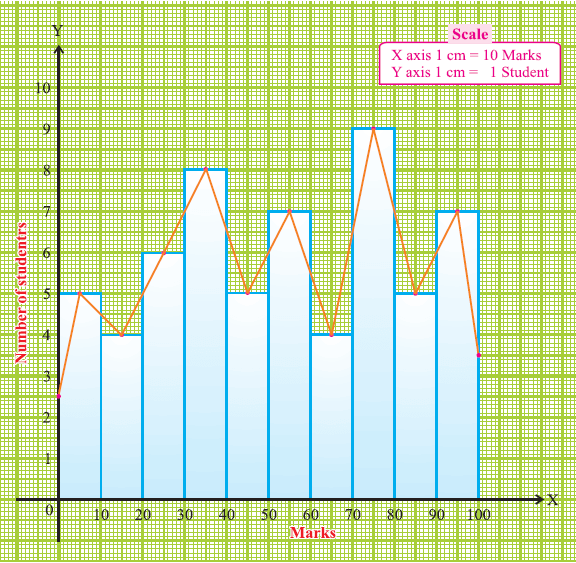
Draw a frequency polygon of the following data using histogram.
|
Marks 0 - 10 10 - 20 20 - 30 30 - 40 40 - 50 50 - 60 60 - 70 70 - 80 80 - 90 90 - 100 |
Number of Students 5 4 6 8 5 7 4 9 5 7 |
Solution :
Mark the class intervals along the X-axis and the number of students along the Y-axis.
Draw a histogram for the given data. Now mark the mid points of the upper sides of the consecutive rectangles. The mid points are joined with the help of a ruler.
Note that, the first and last edges of the frequency polygon meet at the mid point of the vertical edges of the first and last rectangles.
Constructing Frequency Polygon Without Using Histogram
Step 1 :
Obtain the frequency distribution and compute the mid points of each class interval.
Step 2 :
Represent the mid points along the X-axis and the frequencies along the Y-axis.
Step 3 :
Plot the points corresponding to the frequency at each mid point.
Step 4 :
Join these points, by straight lines in order.
Step 5 :
To complete the polygon join the point at each end immediately to the lower or higher class marks (as the case may be at zero frequency) on the X-axis.
Example 4 :
Draw a frequency polygon for the following data without using histogram.
|
Class Interval 10 - 20 20 - 30 30 - 40 40 - 50 50 - 60 60 - 70 70 - 80 80 - 90 |
Frequency 4 6 8 10 12 14 7 8 |
Solution :
Mark the class intervals along the X-axis and the frequency along the Y-axis.
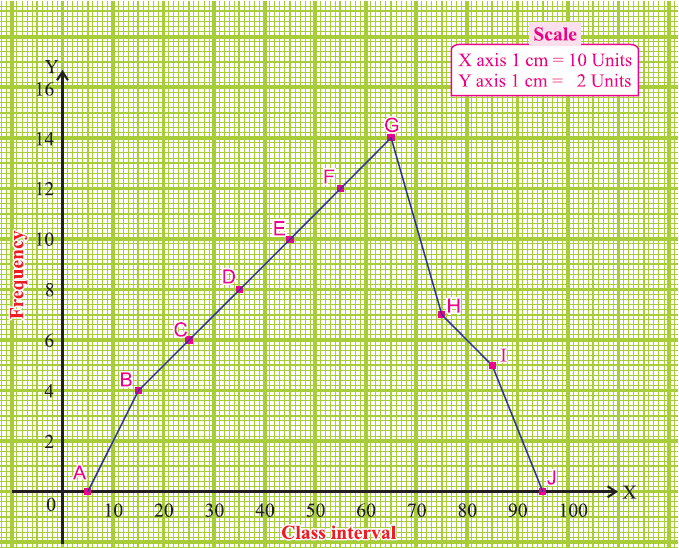
We take the imagined classes 0-10 at the beginning and 90-100 at the end, each with frequency zero.
We have tabulated which is given below.
Class Interval
0 - 10
10 - 20
20 - 30
30 - 40
40 - 50
50 - 60
60 - 70
70 - 80
80 - 90
90 - 100
Midpoints
5
15
25
35
45
55
65
75
85
95
Frequency
0
4
6
8
10
12
14
7
5
0
Using the adjacent table, plot the points A (5, 0), B (15, 4), C (25, 6), D (35, 8), E (45, 10), F (55, 12), G (65, 14), H (75, 7), I (85, 5) and J (95, 0).
We draw the line segments AB, BC, CD, DE, EF, FG, GH, HI, IJ to obtain the required frequency polygon ABCDEFGHIJ, which is given below.
Kindly mail your feedback to v4formath@gmail.com
We always appreciate your feedback.
©All rights reserved. onlinemath4all.com
Recent Articles
-
Sum of the Three Angles of a Triangle
Apr 26, 24 09:20 PM
 Sum of the Three Angles of a Triangle - Concept - Solved Examples
 -
Writing Quadratic Functions in Standard Form
Apr 26, 24 12:39 PM
Writing Quadratic Functions in Standard Form or Vertex Form -
Factoring Quadratic Trinomials
Apr 26, 24 01:51 AM
Factoring Quadratic Trinomials - Key Concepts - Solved Problems