CONSTRUCTION OF FREQUENCY POLYGON WORKSHEET
Problem 1 :
Draw a frequency polygon imposed on the histogram for the following distribution
|
Class intervals 10 - 20 20 - 30 30 - 40 40 - 50 50 - 60 60 - 70 70 - 80 80 - 90 |
Frequency 4 6 8 10 12 14 7 5 |
Problem 2 :
Draw a frequency polygon of the following data using histogram
|
Class intervals 0 - 10 10 - 20 20 - 30 30 - 40 40 - 50 50 - 60 |
Frequency 5 10 25 16 12 8 |
Problem 3 :
Draw a frequency polygon for the following data using histogram
|
Marks 0 - 10 10 - 20 20 - 30 30 - 40 40 - 50 50 - 60 60 - 70 70 - 80 80 - 90 90 - 100 |
Number of students 5 4 6 8 5 7 4 9 5 7 |

1. Answer :
|
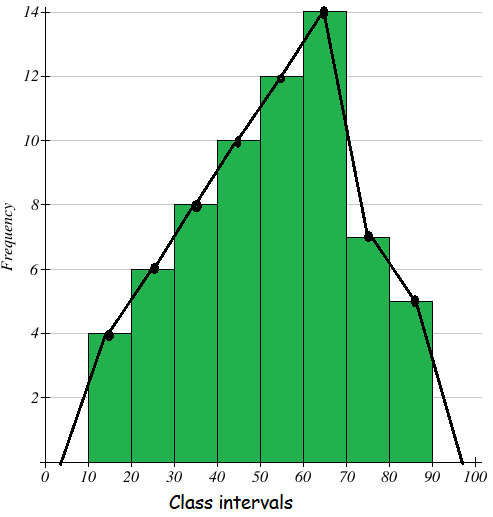
Class intervals 10 - 20 20 - 30 30 - 40 40 - 50 50 - 60 60 - 70 70 - 80 80 - 90 |
Frequency 4 6 8 10 12 14 7 5 |
Take the class-intervals along the X-axis and frequencies along the Y-axis with appropriate scale as shown figure given below.
Draw a histogram for the given data. Now we have to mark the mid points of the upper sides of the consecutive rectangles. We also mark the midpoints of the assumed class intervals 0-10 and 90-100.
The mid points are joined with the help of a ruler. The ends of the polygon are joined with the mid points of 0-10 and 90-100.
Now, we get the frequency polygon.
Scale :
x - axis 1 cm = 10 units
y - axis 1 cm = 2 units
2. Answer :
|
Class intervals 0 - 10 10 - 20 20 - 30 30 - 40 40 - 50 50 - 60 |
Frequency 5 10 25 16 12 8 |
Mark the class intervals along the X-axis and the frequencies along the Y-axis with appropriate scale shown in figure given below.
Draw a histogram for the given data. Now, mark the mid points of the upper sides of the consecutive rectangles. Also we take the imagined class interval (-10) - 0 and 60 - 70. The mid points are joined with the help of a ruler. The ends of the polygon are joined with the mid points of the imagined class intervals (-10)-0 and 60 - 70. Now we get the frequency polygon.
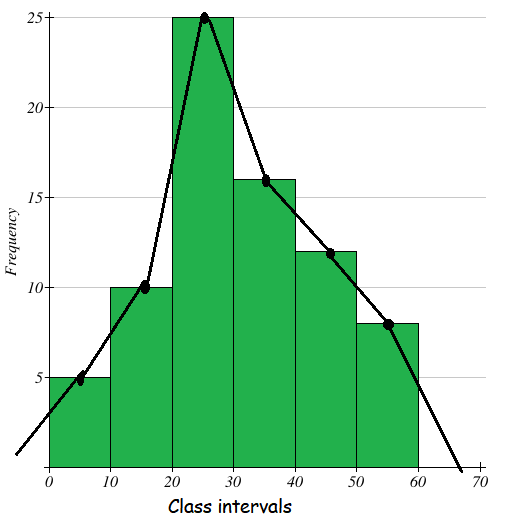
Sometimes imagined class intervals do not exist. For example, in case of marks obtained by the students in a test, we cannot go below zero and beyond maximum marks on the two sides.
In such cases, the extreme line segments are only partly drawn and are brought down vertically so that they meet at the mid points of the vertical left and right sides of first and last rectangles respectively.
3. Answer :
|
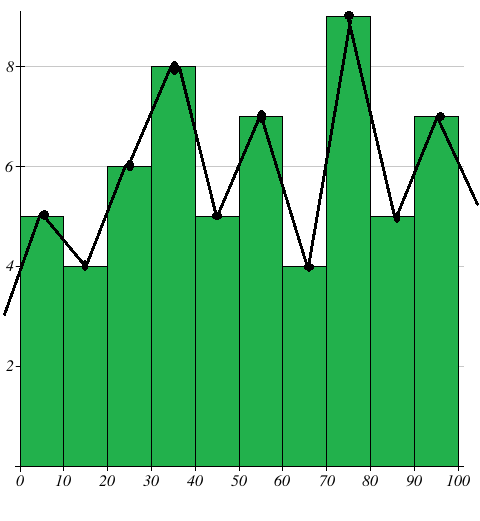
Marks 0 - 10 10 - 20 20 - 30 30 - 40 40 - 50 50 - 60 60 - 70 70 - 80 80 - 90 90 - 100 |
Number of students 5 4 6 8 5 7 4 9 5 7 |
Mark the class intervals along the X-axis and the number of students along the Y-axis. Draw a histogram for the given data. Now mark the mid points of the upper sides of the consecutive rectangles. The mid points are joined with the help of a ruler.
Note that, the first and last edges of the frequency polygon meet at the mid point of the vertical edges of the first and last rectangles.
Kindly mail your feedback to v4formath@gmail.com
We always appreciate your feedback.
©All rights reserved. onlinemath4all.com
Recent Articles
-
Printable Math Worksheets
Apr 20, 24 12:02 AM
Printable Math Worksheets - Worksheets in Pdf formats from grade 1 to 10 -
Printable Math Worksheets for Grade 2
Apr 19, 24 11:58 PM
Printable Math Worksheets for Grade 2 -
Sequences and Series
Apr 19, 24 11:45 PM
Sequences and Series - Concept - Examples